Clinical outcomes of Bacillus Calmette-Guerin refractory bladder cancer
I was recently the consulting statistician for a study that looked into the difference in disease progression between patients with carcinoma in situ (stage Tis) and stage Ta at baseline who had evidence of bladder cancer after bacillus Calmette-Guerin therapy. The purpose of the study was to assess whether the recently updated treatment guidelines that recommend the same treatment course for these groups are appropriate. We found no evidence that the time to progression differs between these groups and concluded that the new guidelines are approprite.
Bacillus Calmette-Guerin (BCG) is an immunotherapy that is sometimes given to patients at high risk of non-muscle-invasive bladder cancer returning after transurethral resection (TURP). The term “BCG refractory” disease refers to cases when patients are treated with BCG but have evidence of residual disease six months after treatment. Recently, guidelines were published that outline treatment recommendations for such patients. These guidelines combine recommendations for patients with high-grade disease with either stage Ta or Tis at baseline, despite a lack of evidence that outcomes between these two groups are similar. We hypothesized that patients with Tis disease are likely to have worse outcomes compared to those with Ta disease.
The study consisted of 112 patients with high-grade Ta or high-grade Tis bladder cancer who underwent BCG treatment and had BCG-refractory disease. Patients’ original TURP slides were reviewed by pathologists to ensure all patients had high-grade disease.
We defined progression, the study outcome, as progression to stage T1 or higher or progression to cystectomy from six months after BCG-refractory treatment.
Since progression to stage T1 would be determined by regular cystoscopy follow up, our first analysis was to assess whether the annual rates of cystoscopies were different between the groups to check. If, for example, Tis patients were considered higher risk and were followed up more regularly, then our time-to-progression analysis could be biased. We therefore used the Wilcoxon rank sum test to evaluate this issue, and performed a sensitivity analysis using Poisson regression. Finally, we used Kaplan Meier methods to investigate the difference in time to progression between patients with Tis and Ta disease.
We found no difference in the rates of cystoscopy follow up, so we concluded that survival anaylsis using Kaplan Meier would be unbiased.
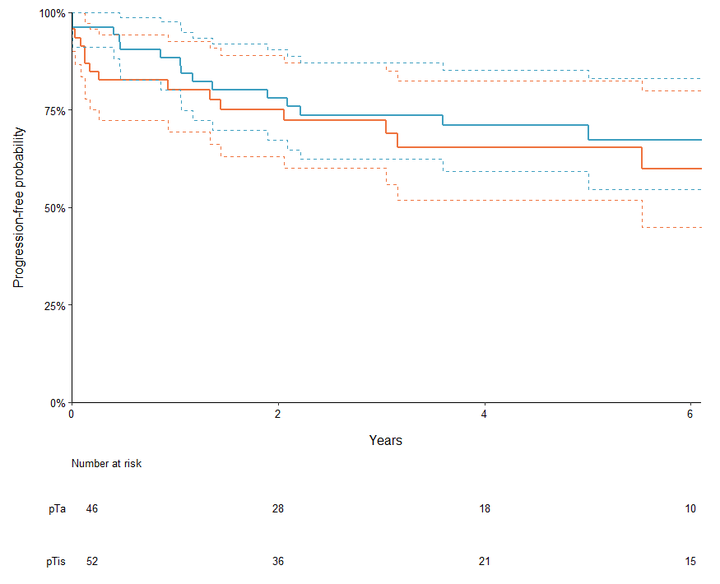
From our survival analysis, we found that five-year progression-free survival rates were 63% (49%, 80%) and 68% (56%, 82%) for stage Ta and Tis patients, respectively. Twenty patients with stage Ta disease at baseline experienced progression, as did 23 with baseline stage Tis disease.
Our results suggest that the progression outcomes for BCG refractory disease are similar between stage Ta and Tis disease, and that combining treatment guidelines for these groups is appropriate.
Over the course of this project, we created a highly customized Kaplan Meier plot (pictured above), which contributed to a standard format for survival plots that our team now uses. The code for the plot is given below.
# create survival plot object
plt_progression <-
  survminer::ggsurvplot(
    model_progression,
    data = df_prog_final,
    conf.int = TRUE,
    conf.int.style = "step",
    risk.table = TRUE,
    fontsize = 3.5,
    legend.labs = c("pTa", "pTis"),
    legend = "none",
    xlim = c(0, 6.1),
    break.x.by = 2,
    surv.scale = "percent",
    censor = FALSE,
    axes.offset = FALSE,
    palette = my_paltette
  ) +
  labs(
    y = "Progression-free probability",
    x = "Years"
  ) +
  survminer::theme_survminer(
    base_size = 12,
    base_family = "",
    font.main = c(10, "plain", "black"),
    font.submain = c(12, "plain", "black"),
    font.x = c(12, "plain", "black"),
    font.y = c(12, "plain", "black"),
    font.caption = c(12, "plain", "black"),
    font.tickslab = c(10, "plain", "black"),
    legend = "none"
  )

# format margins for plot
plt_progression$plot <-
  plt_progression$plot +
  theme(
    plot.margin = unit(c(10, 20, 0, 10), "points"),
    axis.title.y = element_text(vjust = 0, margin = margin(t = 0, r = 15, b = 0, l = 0)),
    axis.title.x = element_text(margin = margin(t = 13, r = 0, b = 0, l = 0))
  )

# format risk table
plt_progression$table <-
  plt_progression$table +
  theme(
    plot.margin = unit(c(10, 20, 0, 10), "points"),
    plot.title = element_text(hjust = 0)
  ) +
  survminer::theme_cleantable()

plt_progression